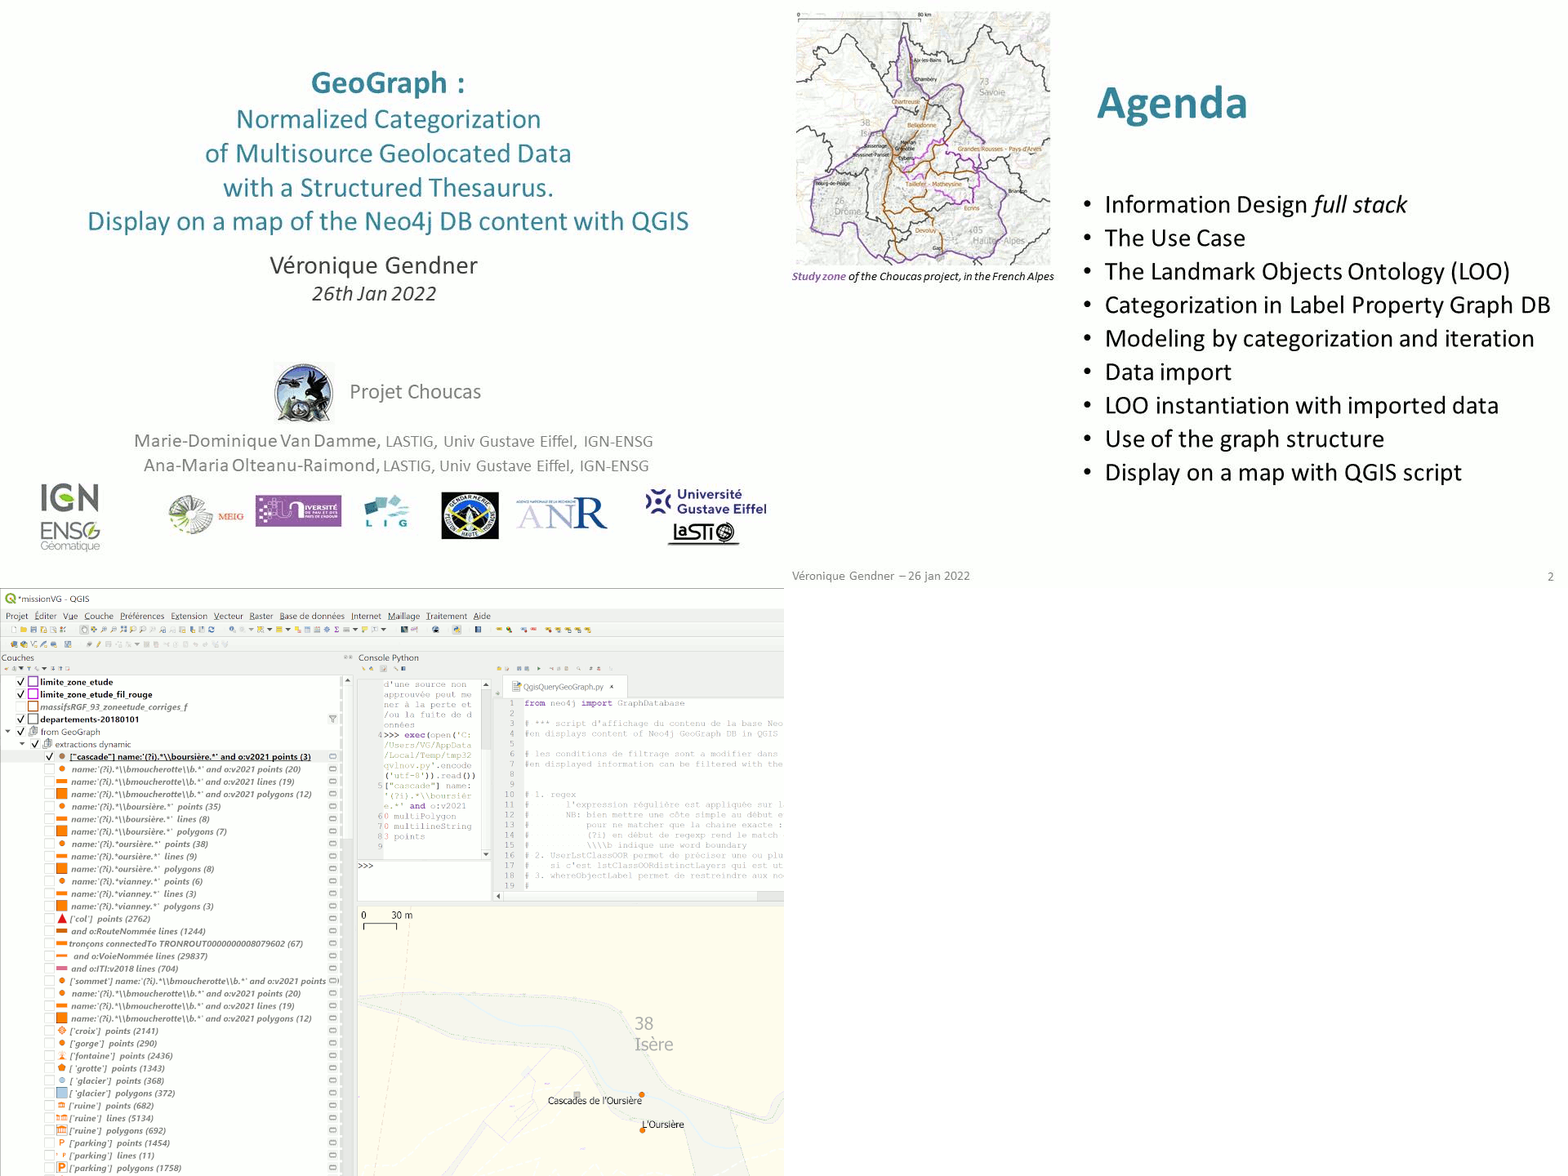
GeoGraph : Normalized Categorization of Multisource Geolocated Data
How GeoGraph, a multisource database of geolocated objects has been build, and how objects categorization is normalized with the Landmarks Objects Ontology build for the Choucas project. We will look into how the graph structure can be used in this context and demo how results of database queries can be displayed on a map, with a QGIS script.

If sound quality is poor, you can watch the video of the presentation here, and for the demo, go back to the above video.
26th Jan 2022 Neo4j Live presentation
This is a more in depth presentation, with a demo, of the brief presentation given at the International Cartographic Conference.
QgisQueryGeoGraph.py : the python script to display GeoGraph in QGIS
GeoGraph Usecase : demo of GASPAR, the UI developed at Laboratoire d’Informatique de Grenoble to help localise the victime, using GeoGraph data (no sound)
 alerte email - nouveaux articles
 fil RSS - nouveaux articles
 Véronique Gendner, e-tissage.net