Design d’information
NODES 2020 : Using Cypher to Extend a Graph-Based Documentation
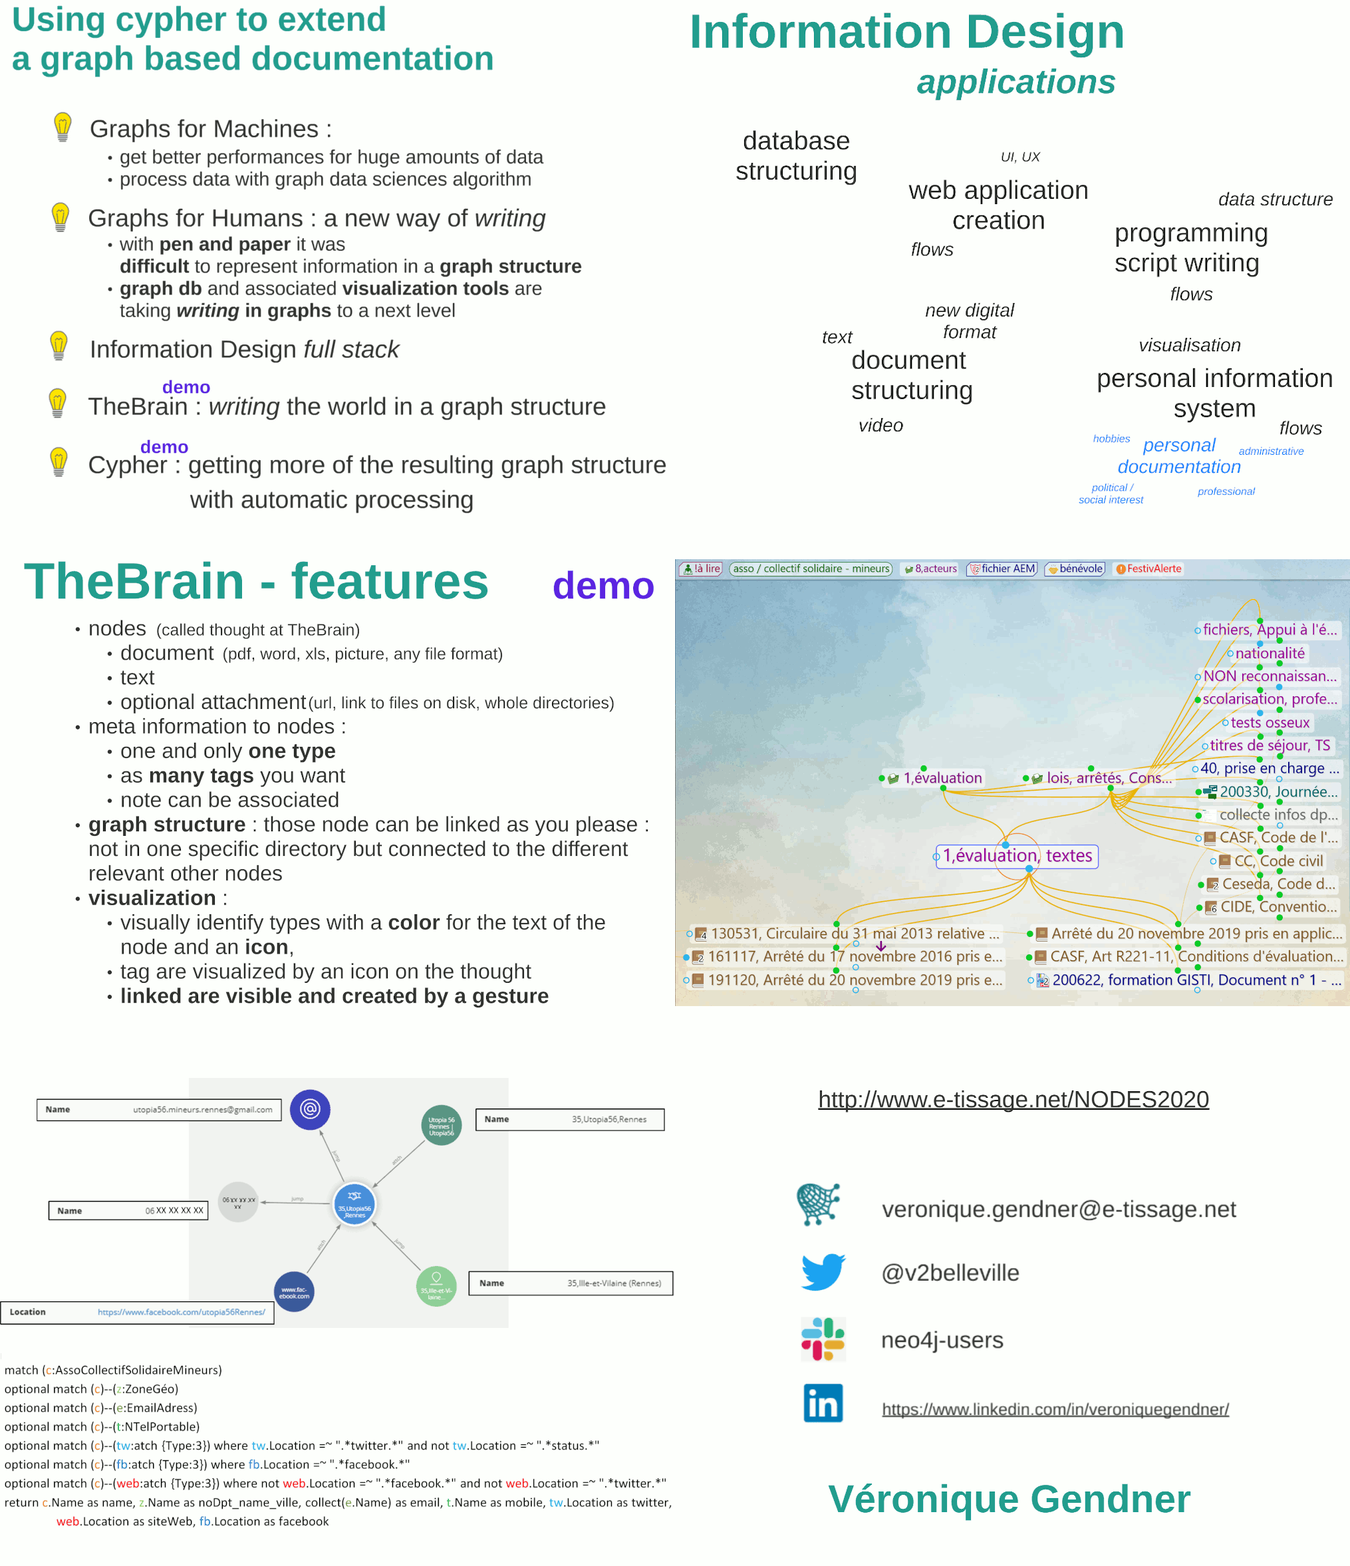
At NODES2020, I’ve presented about graphs for humans : how to manually build a graph structured documentation with TheBrain Technologies, and why this graph writing is so useful.
Also how cypher (Neo4j *) can be used to automatically extract tables or hierarchies needed for specific contexts of use of this documentation.
Along the way, I’ve exposed some ideas about Information Design, the way I see it, that is including all that concerns representation of information but also structuring and the way they are interrelated.

Neo4j for newbies
Introduction videos
Intro to Graph Databases Series (playlist)
Dive right in
Getting started with neo4j in 10 minutes (Excell)
Neo4j sandbox (try it out without installing anything)
In depth learning
Graph academy (free online training)
Getting (seriously) started https://neo4j.com/developer/get-started/
Documentation
Cypher manual (beware of differences if you use 3.5 DB https://neo4j.com/docs/cypher-manual/3.5/)
APOC : essential plugin, in particular for data import https://neo4j.com/docs/labs/apoc/current/
Le choc d’une visualisation : inégalités de richesse aux US
Comme le fait remarquer Ezra Klein dans un papier pour le Washingtonpost, l’étude réalisée par Dan Ariely and Michael Norton’s à propos des inégalités de richesse aux US est passée relativement inaperçue du grand public lors de sa publication en 2011. Et puis un internaute l’a représentée visuellement dans une vidéo :
Lorsque E. Klein publiait son papier début mars 2013, la vidéo en était à 3 m° de visionnage. Fin 2016, elle avait presque attend les 20 M° de visionnage.
De l’importance de la représentation, en particulier pour les questions qui impliquent des chiffres, surtout des chiffres tellement grands qu’ils sont une gageure pour nos capacités humaines de représentation.
Transfer Pricing
Prix de transfert
- Pour expliquer ce qu’est le prix de transfert, il s’agit de comparer deux solutions: avec ou sans le recourt à des juridictions géographiquement distinctes. L’explication s’appuie donc sur un canevas représentant une carte qui, par la simple position du texte, rappelle où se passe la transaction décrite.
- L’utilisation des cadres permet de dévoiler les éléments au fur et à mesure, afin de ne pas submerger le lecteur d’informations, à un point de la démonstration où celles-ci ne seraient pas pertinentes.
- Grace à cet outil de représentation, les phrases qui résument chacune des solutions peuvent être énoncées au fil de l’explication et en même temps, regroupées pour la conclusion.
- La vue de la première partie de la démonstration que l’on retrouve après la description de la seconde solution est un repère utile à la compréhension.
- La vue globale du document, visible à la fin donne un résumé des principaux éléments de l’explication.
 alerte email - nouveaux articles
 fil RSS - nouveaux articles
 Véronique Gendner, e-tissage.net