Représentations
Possibilités de représentation d’information grâce au numérique.
Design d’information : traitement graphique de l’information, entre esthétisme et fonctionnalisme.
Graphs & LLM : an introduction
✅ Explore Core Concepts – Gain a foundational understanding of how graph technologies enhance Generative AI applications. Learn about essential terms and concepts such as embeddings, vector search, and Graph #RAG.
✅ Learn about the #Neo4j property graph model – Understand how it can be leveraged to structure and query data effectively.
✅ Understand Limitations and Opportunities – Identify some of the current limitations of integrating graphs with LLMs and explore opportunities for overcoming these challenges.
✅ Receive Practical Resources – Walk away with a cheat sheet that includes technical basics, helpful documentation, and essential resources. You’ll also receive code examples for Neo4j and #LangChain to help you get started.
Whether you’re new to the potential of combining graphs with LLMs or need to convey these ideas to non-technical colleagues, this talk will help you move forward!
Knowledge Graph Conference demo session : Neodash
Graphs are a very useful formal structure because you can represent in one place, the precise complexity of your data, by interrelating lists, hierarchies, categorizations and tables. You can also avoid being lost in complexity by choosing what to expose for a specific purpose, in any of those more basic formal structures.
NODES 2022 : Genealogy with different graph technologies for data collection & visualization
Graphs are a very interesting structure to get the best of human thinking combined with automatic processing. Through a very intuitively graph based use case – genealogy – the following presentation at the Nodes 2022 conference takes genealogical researches as an example to illustrate possibilities that can be applied to many domain of research. It is demoing several graph issues and technologies, from data collection to visualization, including data transfer from one app to another:
- documentation collection, in a graph structure, with TheBrain Technologies application,
- Gramps visualizations based on a family tree specific layout algorithm
- Bloom for visual and interactive exploration of data structured in graph and
- yWorks to make precisely selected information of interest, stand out on a graph display
- as well as Neo4j graph database as a pivot technology, to make use of graph topology and graph pattern matching
Data collection and export/import process from TheBrain to Gramps via Neo4j are presented, graph models are discussed.
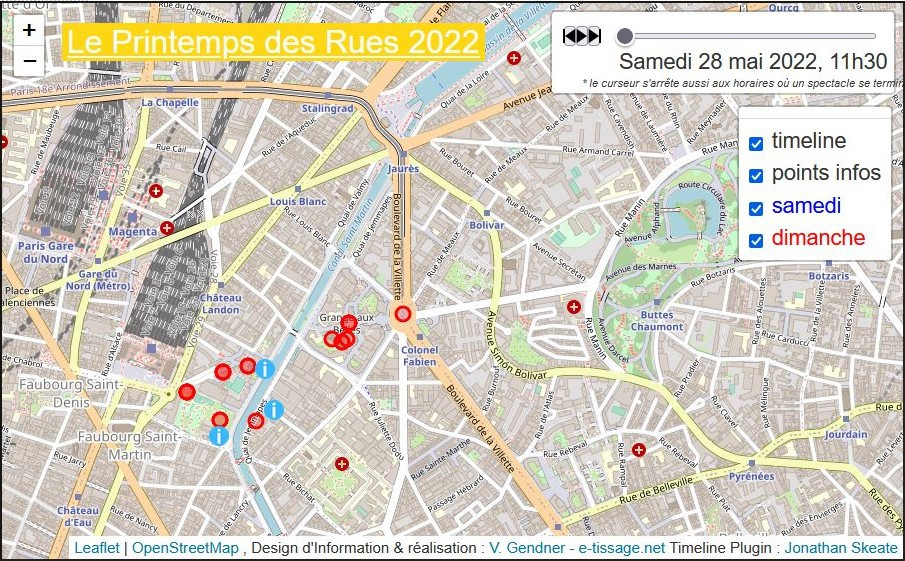
Quoi, où ? mais aussi quand ? une carte avec un curseur de temps (timeline)
Avoir la bonne clé d’accès à l’information est essentiel pour attraper les informations dont nous avons besoin. Les outils numériques ont l’énorme avantage de permettre des représentations avec plusieurs clés d’accès. La création d’une représentation numérique adaptée passe donc par l’identification des clés d’accès utiles. Voyons par exemple, le cas d’un festival qui présente des spectacles dans différents lieux.
 Lire la suite »
Le choc d’une visualisation : inégalités de richesse aux US
Comme le fait remarquer Ezra Klein dans un papier pour le Washingtonpost, l’étude réalisée par Dan Ariely and Michael Norton’s à propos des inégalités de richesse aux US est passée relativement inaperçue du grand public lors de sa publication en 2011. Et puis un internaute l’a représentée visuellement dans une vidéo :
Lorsque E. Klein publiait son papier début mars 2013, la vidéo en était à 3 m° de visionnage. Fin 2016, elle avait presque attend les 20 M° de visionnage.
De l’importance de la représentation, en particulier pour les questions qui impliquent des chiffres, surtout des chiffres tellement grands qu’ils sont une gageure pour nos capacités humaines de représentation.
 alerte email - nouveaux articles
 fil RSS - nouveaux articles
 Véronique Gendner, e-tissage.net